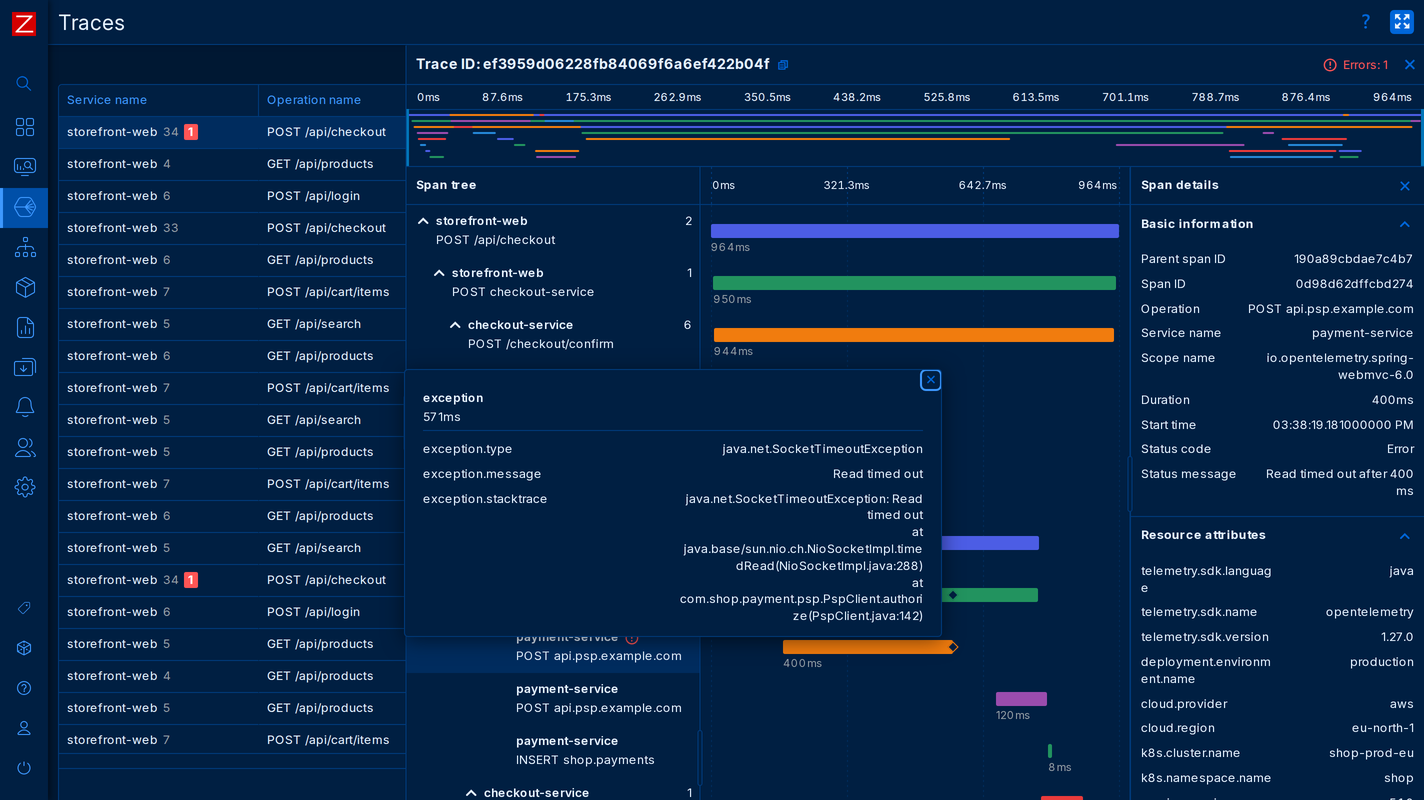
The release of the open monitoring system Zabbix 8.0 has taken place, which is classified as a version with a long period of official support (LTS). Zabbix is a universal system for monitoring the performance and availability of servers, engineering and network equipment, applications, databases, virtualization systems, containers, IT services, web services and cloud infrastructure. The project code is distributed under the AGPLv3 license.
The system implements a full cycle from data collection, processing and transformation, analysis of this data to detect problems, and ending with storing this data, visualization and sending alerts using escalation rules. The system also provides flexible options for expanding data collection and alerting methods, as well as automation capabilities through a powerful API. A web interface is provided for centralized management.
Main improvements in version 8.0 LTS (1, 2, 3):
- Implemented the ability to monitor application performance (APM, Application Performance Monitoring) with data collection using the OpenTelemetry (OTLP/gRPC) protocol to track the passage of requests through applications and services, measuring their performance and identifying the causes of slow or unsuccessful operations. The resulting telemetry data can be used in triggers and visualized on graphs.

- A 10-fold increase in metrics processing performance is announced. Optimizations have been made to reduce CPU load, reduce I/O, and increase scalability. Zabbix startup time has been reduced by simultaneously loading historical data from the database. The Zabbix server, proxy and agent implement caching of DNS queries using the c-ares resolver.