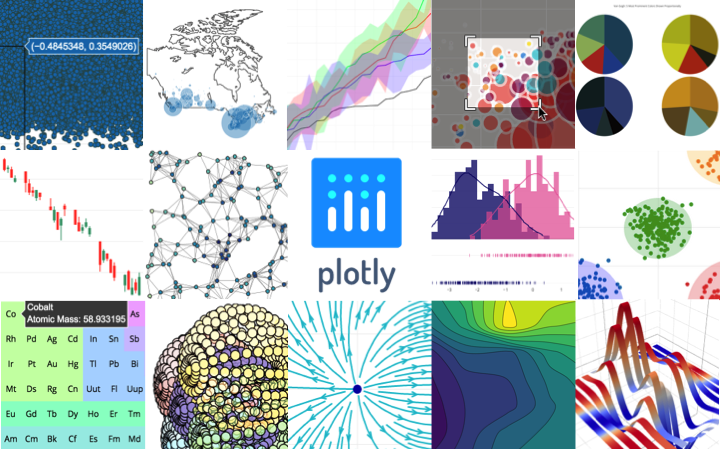
Available New edition of the Python library plotly.py 5.0 providing means for visualizing data and various types of statistics. To draw a library plotly.js , supporting more than 30 types of 2D and 3D graphs, charts and cards (the result is stored in the form of an image or HTML file for interactive display in the browser). Code plotly.py spreads under the MIT license.
in New Release Supported support Python 2.7 and Python 3.5, for work now required at least Python 3.6. Violating the compatibility of the change is made, including a large portion of outdated capabilities have been removed, the default values are changed and the support of Internet Explorer 9/10 browsers is stopped. Plotly.js library updated from version 1.58.4 to 2.1. Implemented a new addition to integration with JUPYTERLAB. 5-10 times increased performance when serializing data in JSON format. Added the ability to fill the column charts with textures and proposed a new type of diagrams – “ Icicle “, rectangular analogue of circular charts for visual evaluation size differences Values.

