Bloomberg has opened the source code of Memray , toolkit for profiling memory in the applications in Python. The program tracks memory allocation operations in Python and offers a visual interface for analyzing and optimizing memory consumption by various sections of the code, as well as connected modules written in C / C ++. Reports can be formed both in interactive form and generated in HTML format. The composition includes a CLI interface to manage profiling and a library that can be used to track memory operations in third-party projects. Code Published under the APACHE 2.0 license. Work is supported only on the Linux platform.
Main features:
- Application Areas: Detection of reasons for large memory consumption in applications, search for memory leaks and definition code that performs too many memory allocation operations.
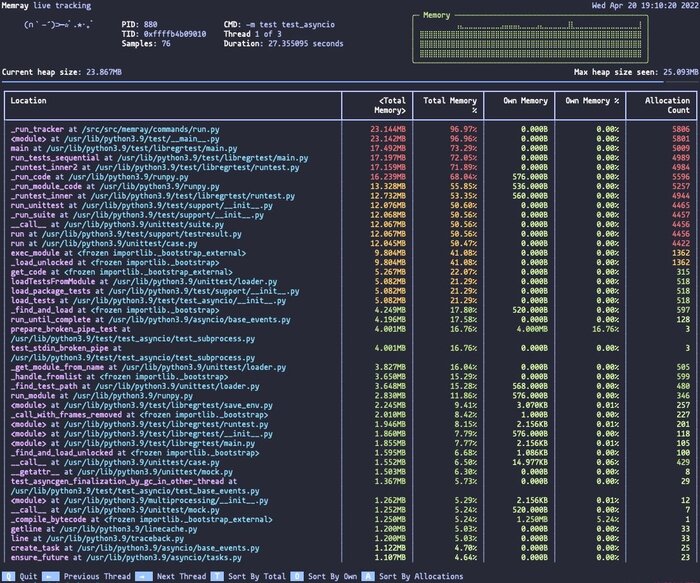
- Tracking all feature calls in binding to the general memory consumption, consumption inside the function and the number of memory allocation operations. Ability to accurate estimate Call stack .
- Processing calls to libraries on C / C ++ and accounting for memory consumption in native modules. Support for analyzing projects using Numpy and Pandas.
- Minimum overhead and minor impact on the performance of the Annex Announced. Ability to disconnect the tracking of a native code to increase productivity.
- The presence of a large number of memory usage reports, including visual hierarchical and step graphs (Flame Graph).
- Ability to work with streams and analysis of memory in the context of individual threads. Supported both Python streams and native streams, such as C ++ Threads, used in modules on C / C ++.
- The ability to Integration with PyTest and providing Pytest annotations that determine the memory consumption framework when you exit that in the process of execution of tests will be Form warnings.

/Media reports.